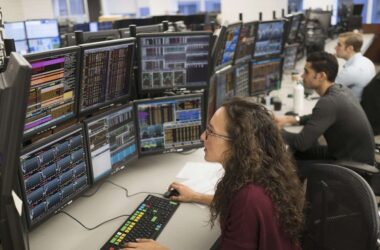
Achieving a professional level of day trading expertise is a challenging endeavor, necessitating discipline, exceptional risk and money management skills, and a comprehensive understanding of the market. A profound comprehension of various technical indicators is also essential to ascend to the top. These trading indicators offer technical analysis of market conditions, insights into market psychology, and assessments of the supply and demand for securities. They are even capable of providing reliable predictions based on complex computations.
One of the most commonly observed indicators on a professional trader’s chart is the moving average. There are two types of moving averages to utilize: the simple moving average (SMA) and exponential moving average (EMA). The choice between them depends on the time frame being studied. Traders often use both to make comparisons, helping determine if a stock is experiencing an uptrend or downtrend. Professionals typically prefer the EMA indicator due to a potential drawback in the SMA indicator, which places equal weightage on all price points, potentially leading to redundancy
Another widely used indicator is the on-balance volume (OBV). It works by maintaining a running total of up volume and subtracting down volume, indicating market participation strength. A rising OBV during price movements suggests strong market participation, while a falling OBV indicates selling volume surpassing buying, signaling lower prices. OBV serves as a valuable tool for trend confirmation.
These examples only scratch the surface of the top indicators that traders should incorporate into their toolkits. For a more in-depth understanding, please refer to the accompanying resource from NinjaTrader for further information.
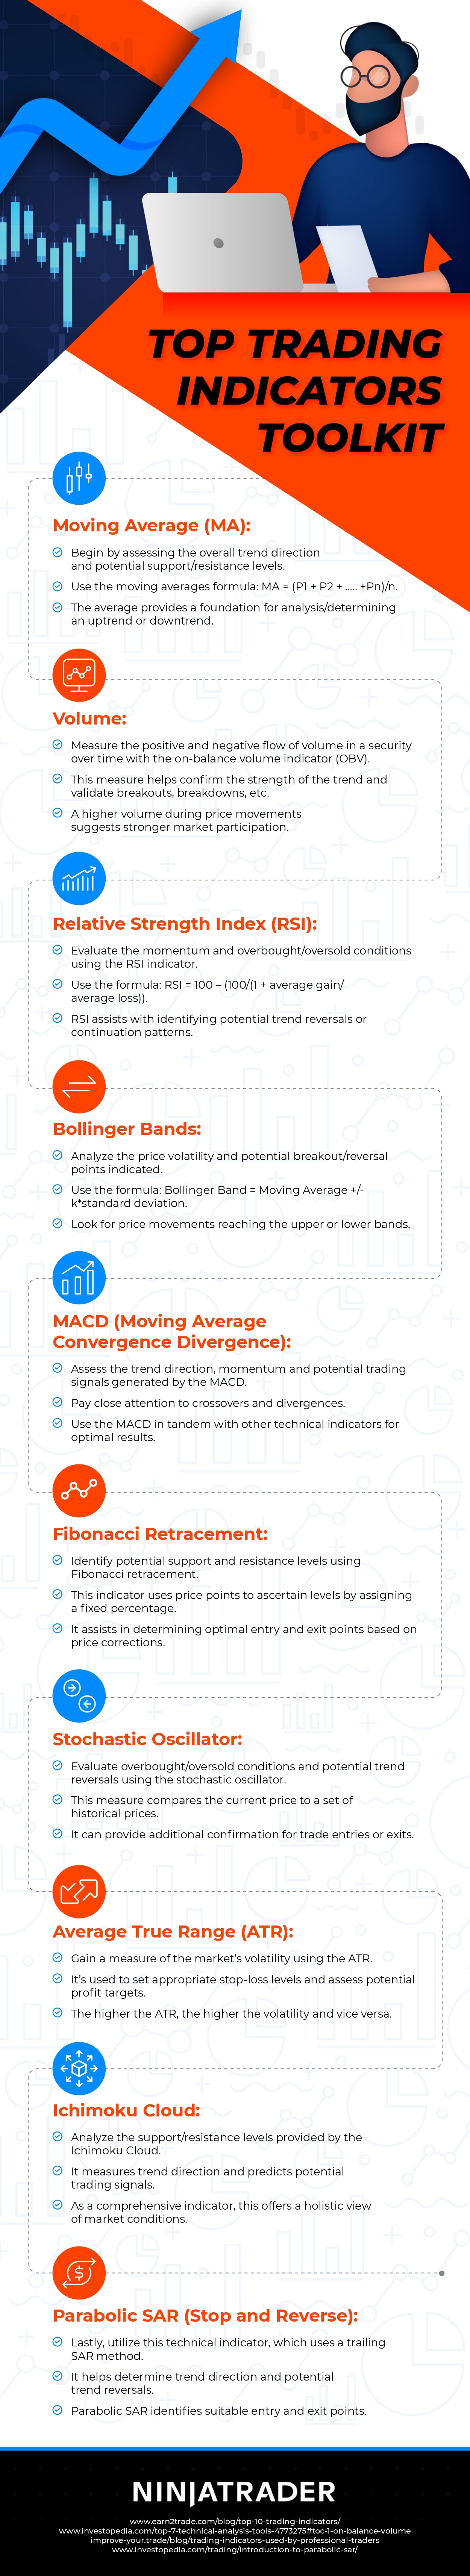
Top Trading Indicators Toolkit from NinjaTrader, a futures broker